


Maximizing Completion of the Two-Dose COVID-19 Vaccine Series with Aid from Infographics
University of Southern California School of Pharmacy
"Infographics offer a rapid and versatile means to educate patients about vaccines..."
Vaccines requiring multiple doses, as is the case with all but one of the COVID-19 vaccines in use in the world as of this writing, pose a challenge to ensuring the world's population achieves a sufficient level of immunity against COVID-19. The surge of misinformation that has accompanied the pandemic exacerbates this situation. First-time recipients of multidose COVID-19 vaccines remain prone to vaccine hesitancy even after receiving a first inoculation, and they may become increasingly intimidated by the prospect of robust immune responses that are sometimes reported by recipients of the second dose. This article describes the results of a study that sought to determine whether completion of a two-dose COVID-19 vaccine regimen could be improved by disseminating infographics that explain what the vaccine is and why returning for the second dose is important.
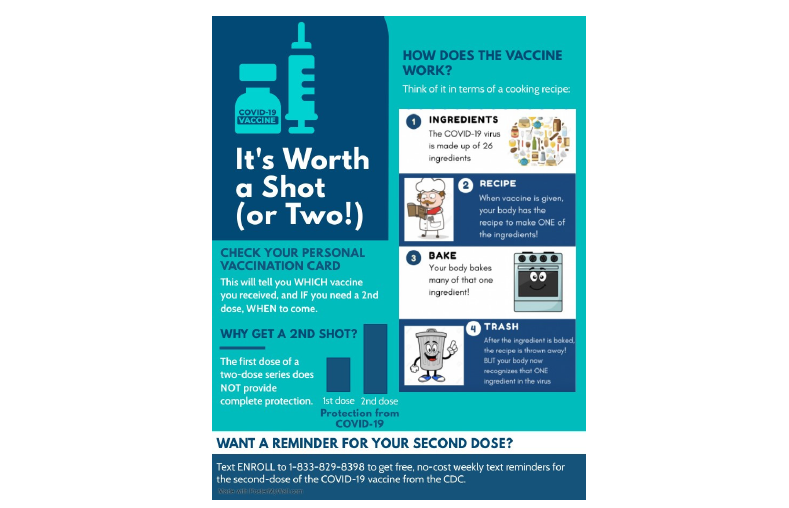
The researchers from the USC School of Pharmacy created a simple, standalone infographic - in English and in Spanish - about the COVID-19 vaccine and the new mRNA technology, which they offered to vaccine recipients in a clinic in Los Angeles (LA), California, United States, at the time of their first inoculation with the Pfizer vaccine. The infographic (see above) was created to explain, using lay terminology, how the COVID-19 vaccine works and the benefits of completing the multidose series. The infographic conveys the following information to readers: (i) The potential of two-dose COVID-19 vaccines to protect against SARS-CoV-2 is not fully realised from a single dose; and (ii) COVID-19 vaccines are insufficient to cause SARS-CoV-2 infection. In developing the content, the researchers sought input from community advocates and leaders in clinical pharmacy.
The endpoint of the study was defined as three weeks after the researchers distributed the infographic (between June 21 and July 9 2021). Three weeks is the duration after which individuals who received the COVID-19 infographic first became eligible to return to the clinic for their second inoculation, defined as the effect period (July 12 to 30 2021). During this period, the researchers observed the highest fractions of returnees to the clinic. The trend showing the increased return of patients to the clinic for their second dose continued for the remainder of the effect period, with returnees for the second vaccine dose comprising 60.9% ± 17.5% of the daily visits, on average, compared with 24.2% ± 5.6% from the pre-study period.
Based on these data, as well as on a review of LA County records to determine the daily fraction of first- and second-dose recipients of two-dose COVID-19 vaccines in surrounding communities during the window corresponding to the effect period of the study, the researchers conclude that the proportion of COVID-19 vaccine recipients returning for a second inoculation grew after COVID-19 vaccine infographics were distributed in the clinic under study.
Despite the study's limitations, the researchers assert that: "...continued communication with vaccine recipients throughout the vaccination window, extending into and beyond the time of the first inoculation appointment, remains an important part of outreach....and...infographics are useful tools to aid and bolster the deployment of COVID-19 vaccines."
Vaccines 2021, 9(11), 1229; https://doi.org/10.3390/vaccines9111229.
- Log in to post comments