


VINCENT: A Visual Analytics System for Investigating the Online Vaccine Debate
Western University
"In today's environment of big data, people are often victims of information overload....By combining human insight with powerful data analytics and integrated data visualizations and human-data interaction, VASes can help alleviate this problem."
As the use of the internet expands, people increasingly engage online in social discourse and debate in various areas of interest, generating a great deal of online data. One such topical focus is immunisation; the rise in accessibility to, and widespread use of, the internet has played a role in amplifying the voice of the anti-vaccination movement. An automated approach that would allow an analysis of such online discussions and information could help illuminate the public health problem of declining vaccine rates. This paper describes VINCENT (VIsual aNalytiCs systEm for investigating the online vacciNe debaTe), a visual analytics system (VAS) that is designed to help public health stakeholders (i.e., users) make sense of data from websites involved in the online debate about vaccines.
After a sketch of the vaccine debate, Section 2 of the paper provides a conceptual and terminological background on:
- VASes, which are composed of 3 integrated components: an analytics engine, data visualisations, and human-data interactions. Two resources available to assist in developing VASes are the open source D3.js JavaScript library and Tableau software. VASes incorporate one or more data analysis techniques including (but not limited to) supervised learning (i.e. decision trees or support vector machines - SVMs) and cluster analysis.
- Webometrics: Evaluative webometrics can include examining webpages for properties such as the number of external inlinks they receive (links directed to a website from another website) and the website location. Relational webometrics focuses on "providing an overview of the relationships between different actors".
- Natural language processing (NLP), which encompasses a wide range of research topics, 2 of which are text-based emotion detection and word frequency.
Section 3 describes the development and various components of VINCENT, which allows users to explore visualisations of data from a group of 37 vaccine-focused websites. These websites differ in their position on vaccines, topics of focus about vaccines, geographic location, and sentiment towards the efficacy and morality of vaccines (specific and general ones). By integrating webometrics, NLP of website text, data visualisation, and human-data interaction, VINCENT helps users explore complex data. One portion of Section 3 explores how VINCENT does this:
- At the global system level, users can perform several interactions on VINCENT that not only affect displayed data at individual, sub-system levels of VINCENT, but also change displayed data at the level of the whole system. Global system interactions in VINCENT include website selection and filtering of websites:
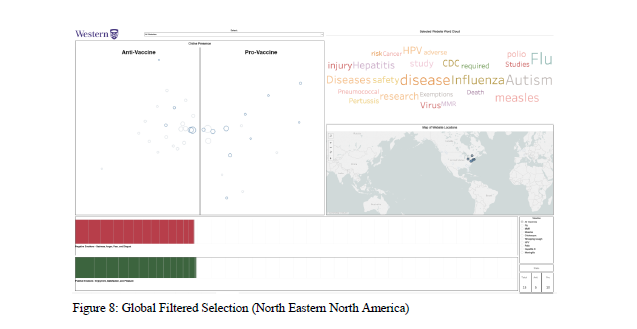
- The website selection interaction allows users to highlight a single website's data throughout the system in order to determine the website's position on vaccination, online presence, location in the world, and emotion about specific vaccines. If, say, a user was interested in learning more about the website "SaneVax", he or she would select this website from the existing options on VINCENT. For this selected website, the user can find that the website's position is anti-vaccine, that it has strong online presence, that it is located in the northwestern part of North America, that it has more negative emotions regarding vaccines than positive, and that it discusses many issues related to human papillomavirus (HPV) (i.e., Cervarix, Gardasil, Cancer, Silgard, HPV). In addition, users have the ability to filter the data to focus on a selected group of websites. Users can highlight and select websites using any of the 3 visualisations (the online presence map, map of website locations, or emotion bar chart), thereby filtering and isolating the data points of a subset of websites.
- At the sub-systems level of VINCENT, users can perform such interactions as filtering the emotion bar chart to display selected vaccines, hovering display elements to expand an information box, or navigating the map of website location. For example, a user who is curious about the emotions of the entire set of websites regarding the measles, mumps, and rubella (MMR) vaccine could select this vaccine; the bar charts would change to display the data. The user can see that there is a greater level of negative emotion on the set of websites than positive emotion regarding the MMR vaccine.
Section 4 provides a summary and conclusions. In essence, this paper demonstrates that VASes can integrate different computational techniques; that such systems can help with the exploration of public health online debates that are distributed across a set of websites; and that care should go into the design of the different components of such systems. To expand on the latter point, considerations designed to help those who seek to create VASes such as VINCENT include:
- Decide which tool to use to create the VAS. There are advantages and disadvantages to using more programming intensive solutions (such as D3.js) versus more rigid, yet easier to use, toolkit-based solutions (such as Tableau).
- Identify the appropriate online data sources; researchers need to keep abreast of the currently available data. Depending on the resources available to the developer, alternate methods and sources for acquiring proprietary data could improve the value of the system.
- Determine which visualisations are most appropriate for each type of studied dataset. For example, the emotion bar charts, presented here, went through several iterations. At first, tree maps were tested but were found to be inadequate at representing certain aspects of the data.
- Incorporate meaningful interactions into the VAS. It is necessary to analyse the tasks that users would need to perform and then to determine what combinations of interactions would facilitate the performance of these tasks. In the case of VINCENT, such tasks included comparing websites, identifying groups of websites, and identifying trends in the entire set of websites.
VINCENT was developed to help users make sense of the data from vaccine websites and, ultimately, the online vaccine debate. However, according to the researchers, there are other areas, both within and outside of public health, for which a system such as this could also prove useful. For instance, a similar VAS could be useful for researchers seeking to acquire insight into the online debate on cannabis; it could, presumably, enable them to determine what, if any, actions could be taken (or policies adopted) to improve public health in this area.
The researchers plan to conduct user testing of VINCENT to evaluate whether there is observable benefit to using it, and, if so, to what extent and in what ways. They expect that the findings of this research will lead to the development of best practices for creating similar VASes to support exploration of other public health issues.
Online Journal of Public Health Informatics 11(2):e5, 2019 https://doi.org/10.5210/ojphi.v11i2.10114
- Log in to post comments